Converting NodeJS CPU profiles to pprof
Tags: low-level
I wrote v8profile-to-pprof, which converts V8 CPU profiles to pprof. This lets you convert Javascript profiles captured by NodeJS or in Google Chrome and open them in pprof.
Why I like pprof
My favorite thing about pprof is that it is great for data analysis.
Merging profiles: You can use
pprof -proto ... > output.pb.gzto merge a bunch of pprof profiles into one. This is great if you have 100s of profiles and want to see what the “average” one looks like.Comparing profiles:
pprofhas comparison functionality (-diff_base) which lets you see what changed between two profiles.Distribution of times: If you want more specific distribution statistics,
pprof -topis great for ad-hoc data analysis. For example, lets say you have a lot of profiles and you want to see how much time you spend in thefoofunction in each profile. It’s just a simple shell script away:
for f in *.pb.gz; do
    ~/go/bin/pprof -top -unit ms -nodefraction 0 $f
done | awk '/ foo$/{print $4}'
For interactive use, pprof’s viewer has some great features. It’s
easiest to contrast with what Chrome’s DevTools provides. Here’s
the “Chart” view of DevTools:
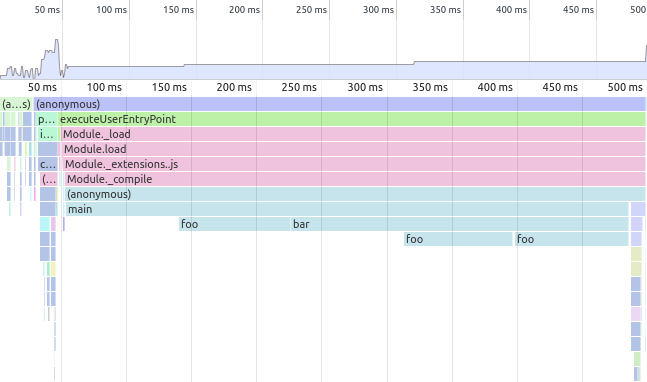

I found the call graph view harder to understand at first, but it’s
great for long profiles with many functions. It’s especially useful if
you have single function which is called from different places (for
example, foo in the above sample). pprof’s view lets you easily see
all the callers and callees, which is much harder in the timeline view.
pprof also provides other nice views, like flamegraphs and
source-views. Strangely, one thing it does not provide is the timeline
view, so having the original CPU profile around is also useful.
For more details on pprof, see their README.
Technical Notes
I wrote this in Haskell. I am not super good at Haskell (yet), so caveat emptor.
I used aeson to parse the V8 CPU profile (since it’s just
JSON under the hood). pprof takes in gzipped protobufs, so I used
proto-lens to generate an encoder based on the
profile.proto in pprof.
Since I was already using lenses for proto-lens, I opted to use lenses
for my state too. I am not very happy with how the code turned out – it
felt like lenses made it really easy to use state, and so I ended up
with way too much state. For example, here’s what the main function
looks like:
data PprofState = PprofState
  { _internStringTable :: StringTable,
    _internFunctionTable :: FunctionTable,
    _parentNodes :: ParentNodeMap,
    _nodesById :: M.Map Int64 ProfileNode,
    _previousStack :: V.Vector Int64
  }

makeLenses ''PprofState

convertProfile :: V8Profile -> State PprofState P.Profile
convertProfile v8profile = do
  forM_ (nodes v8profile) $
    liftM2 (>>) (zoom parentNodes . populateParentMap) processNode
  pure defMessage
    >>= addSamples (uncurry V.zip $ (samples &&& timeDeltas) v8profile)
    >>= addSampleTypes
    >>= addLocationTable
    >>= addFunctionTable
    >>= addStringTable
This looks pretty but it is IMO quite ugly. I really should have untangled the state dependencies here. In particular:
- The first
forM_populates_parentNodes,_nodesByIdand_internFunctionTable. addSamplesdepends on_parentNodesand_nodesByIdbeing correctly populated.addFunctionTabledepends on_internFunctionTable.addLocationTabledepends on_nodesByIdand_internFunctionTable.addStringTabledepends on everything before it.
So I have ended up with spaghetti. With the benefit of hindsight, I would have made the dependencies explicit.
convertProfile :: V8Profile -> State PprofState P.Profile
convertProfile v8profile = do
  let parentNodes = createParentNodes v8profile
      nodesById = createNodesById v8profile
      internFunctionTable = createInternFunctionTable v8profile
      samples = samples v8profile
      timeDeltas = timeDeltas v8profile
  pure defMessage
    >>= addSampleTypes
    >>= addSamples (V.zip samples timeDeltas)
    >>= addFunctionTable internFunctionTable
    >>= addLocationTable internFunctionTable nodesById
    >>= addStringTable
I probably would leave the addStringTable state implicit, because it
would get unwieldy to pass around otherwise. But I really have no excuse
for why PprofState is so large.
One other “low-light” of the code was that I ended up a little confused
between Int64, Word64 and Int. proto-lens only uses Int64 and
Word64, whereas a lot of my functions used Int. So I ended up with a
lot of fromIntegral to convert the output for proto-lens, and I’m
still not totally convinced it’s correct. It probably would have made
more sense just to do everything with Int64/Word64 for consistency.
Anyway aside from the pretty poor state management I’m decently happy with how the code turned out.
Future Features
I’d like to support line ticks. V8’s CPU profiles actually have
line-level granularity under a field called positionTicks.
      "positionTicks": [
        { "line": 17, "ticks": 1 },
        { "line": 14, "ticks": 79 },
        { "line": 13, "ticks": 3 }
      ]
This tells us that line 14 of the relevant function was much slower than the other two lines. For some reason, Chrome’s DevTools do not expose this information at all. Currently I just group everything by functions when I spit them out, but I want to support these line level ticks too so you can see them in pprof.
On a more mundane note, I’d also like better usability. Right now it
doesn’t take any command line arguments (not even --help) nor does it
gzip the resulting protobuf, so it’s a little unwieldy to actually do the
conversion:
v8profile-to-pprof < profile.cpuprofile | gzip -c > profile.pb.gzI think this’ll become more relevant, as I also want to support memory and allocation profiles too.
Finally, I want tests and a release system. It’s relatively small code right now, so I just test it manually. I did set up a nightly build, but I haven’t gone through the legwork of writing snapshot tests and integrating with sourcehut’s repository artifacts for releases. I also want to figure out how to compile for other machines besides x86-64 Linux.